Overview
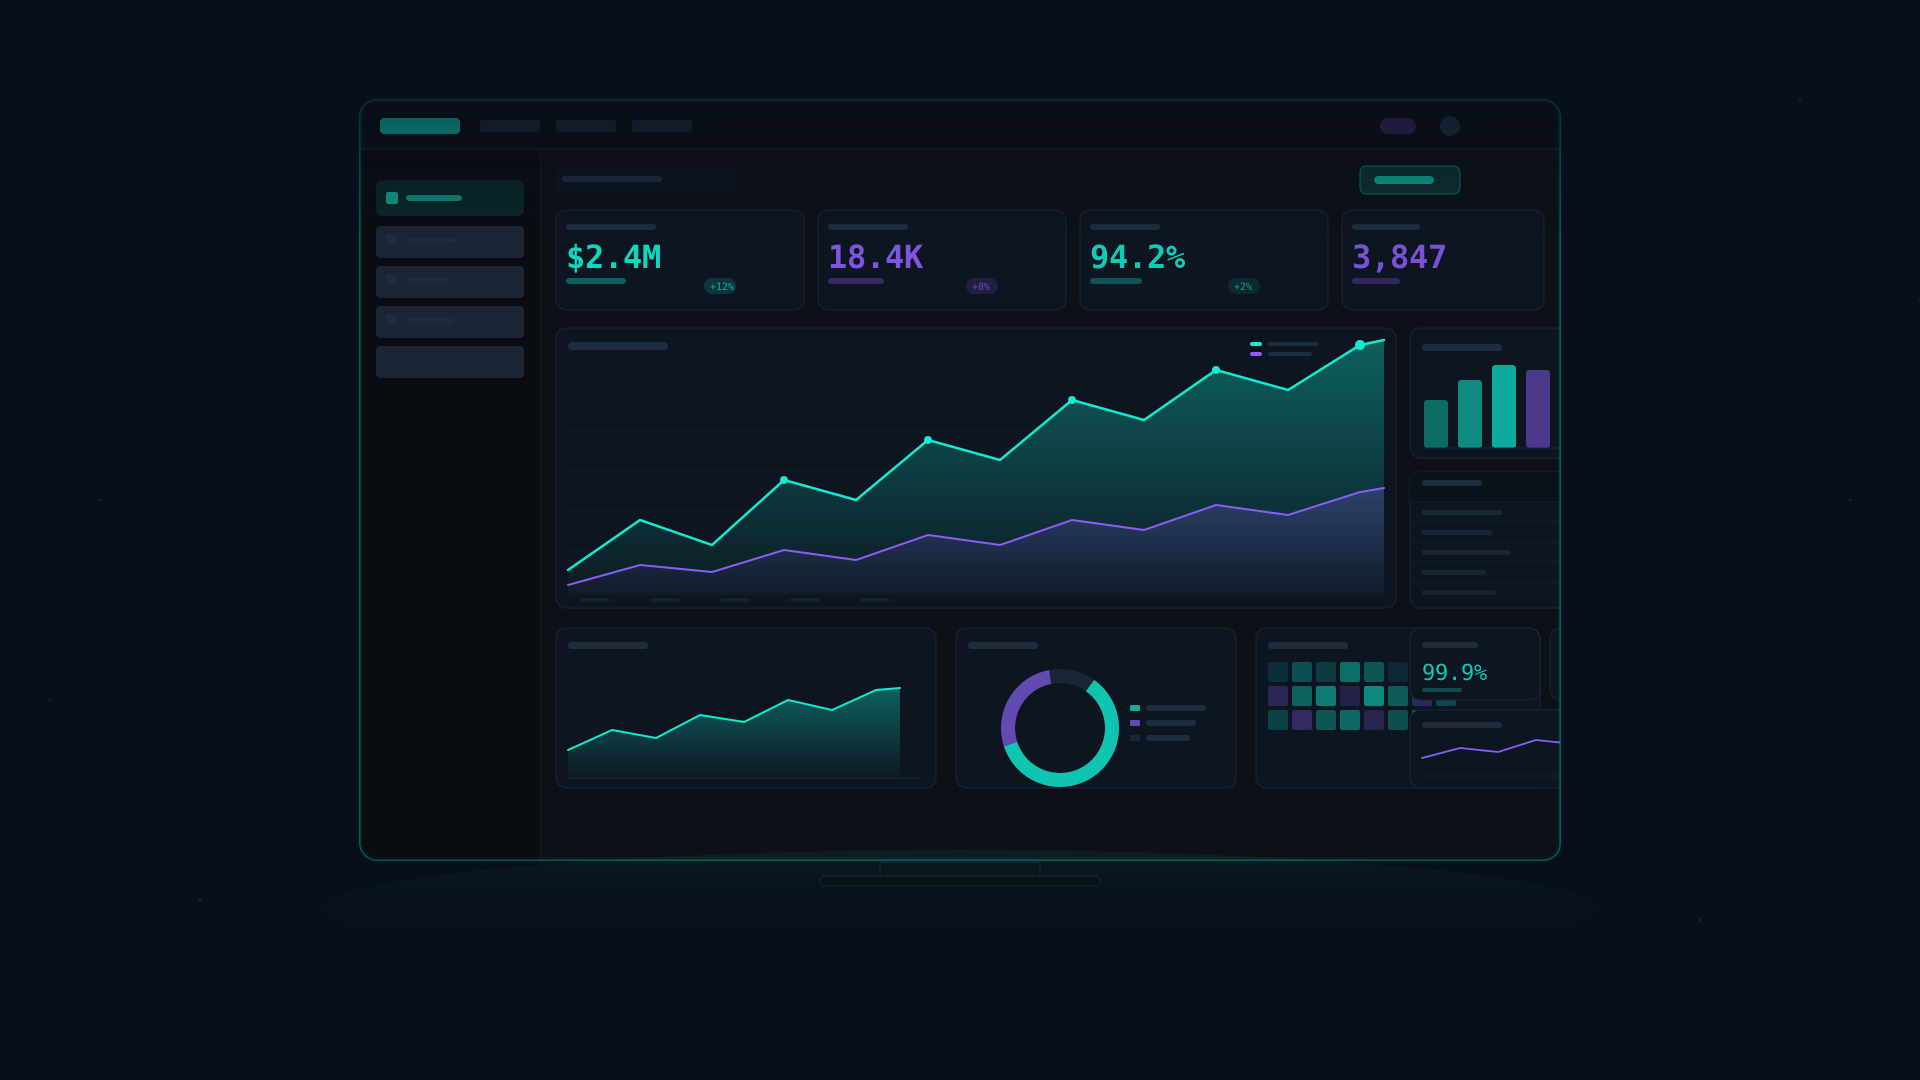
Our client had a five-year-old Angular dashboard that was slow, hard to maintain, and failing Lighthouse audits. Their team needed a complete rebuild without disrupting existing API contracts.
The Challenge
Migrate 40+ chart components, 12 data tables, and a complex filter system from Angular to React — without downtime and while the product team continued shipping features.
What We Built
- New design systemComponent library in Tailwind CSS + shadcn/ui, with dark/light mode from day one
- Performance-first architectureServer Components for data-heavy views, client-side charts only where interactivity required
- Zero-downtime migrationFeature-flagged rollout with A/B comparison mode for QA validation
- Real-time updatesWebSocket integration for live metric streaming
Results
The new dashboard cut average load time from 4.2s to 1.3s (70% reduction), Lighthouse performance score reached 96, and user session duration tripled within 30 days of launch.